QuickNXS GUI Overview
QuickNXS bundles the full polarized reflectometry workflow into a single windowed application so that scientists can load NeXus files, tune the region of interest (ROI), and generate stitched reflectivity curves without juggling multiple scripts. This page gives a high-level tour of the experience so new users know where to start and what feedback to expect from the interface.
Primary Layout
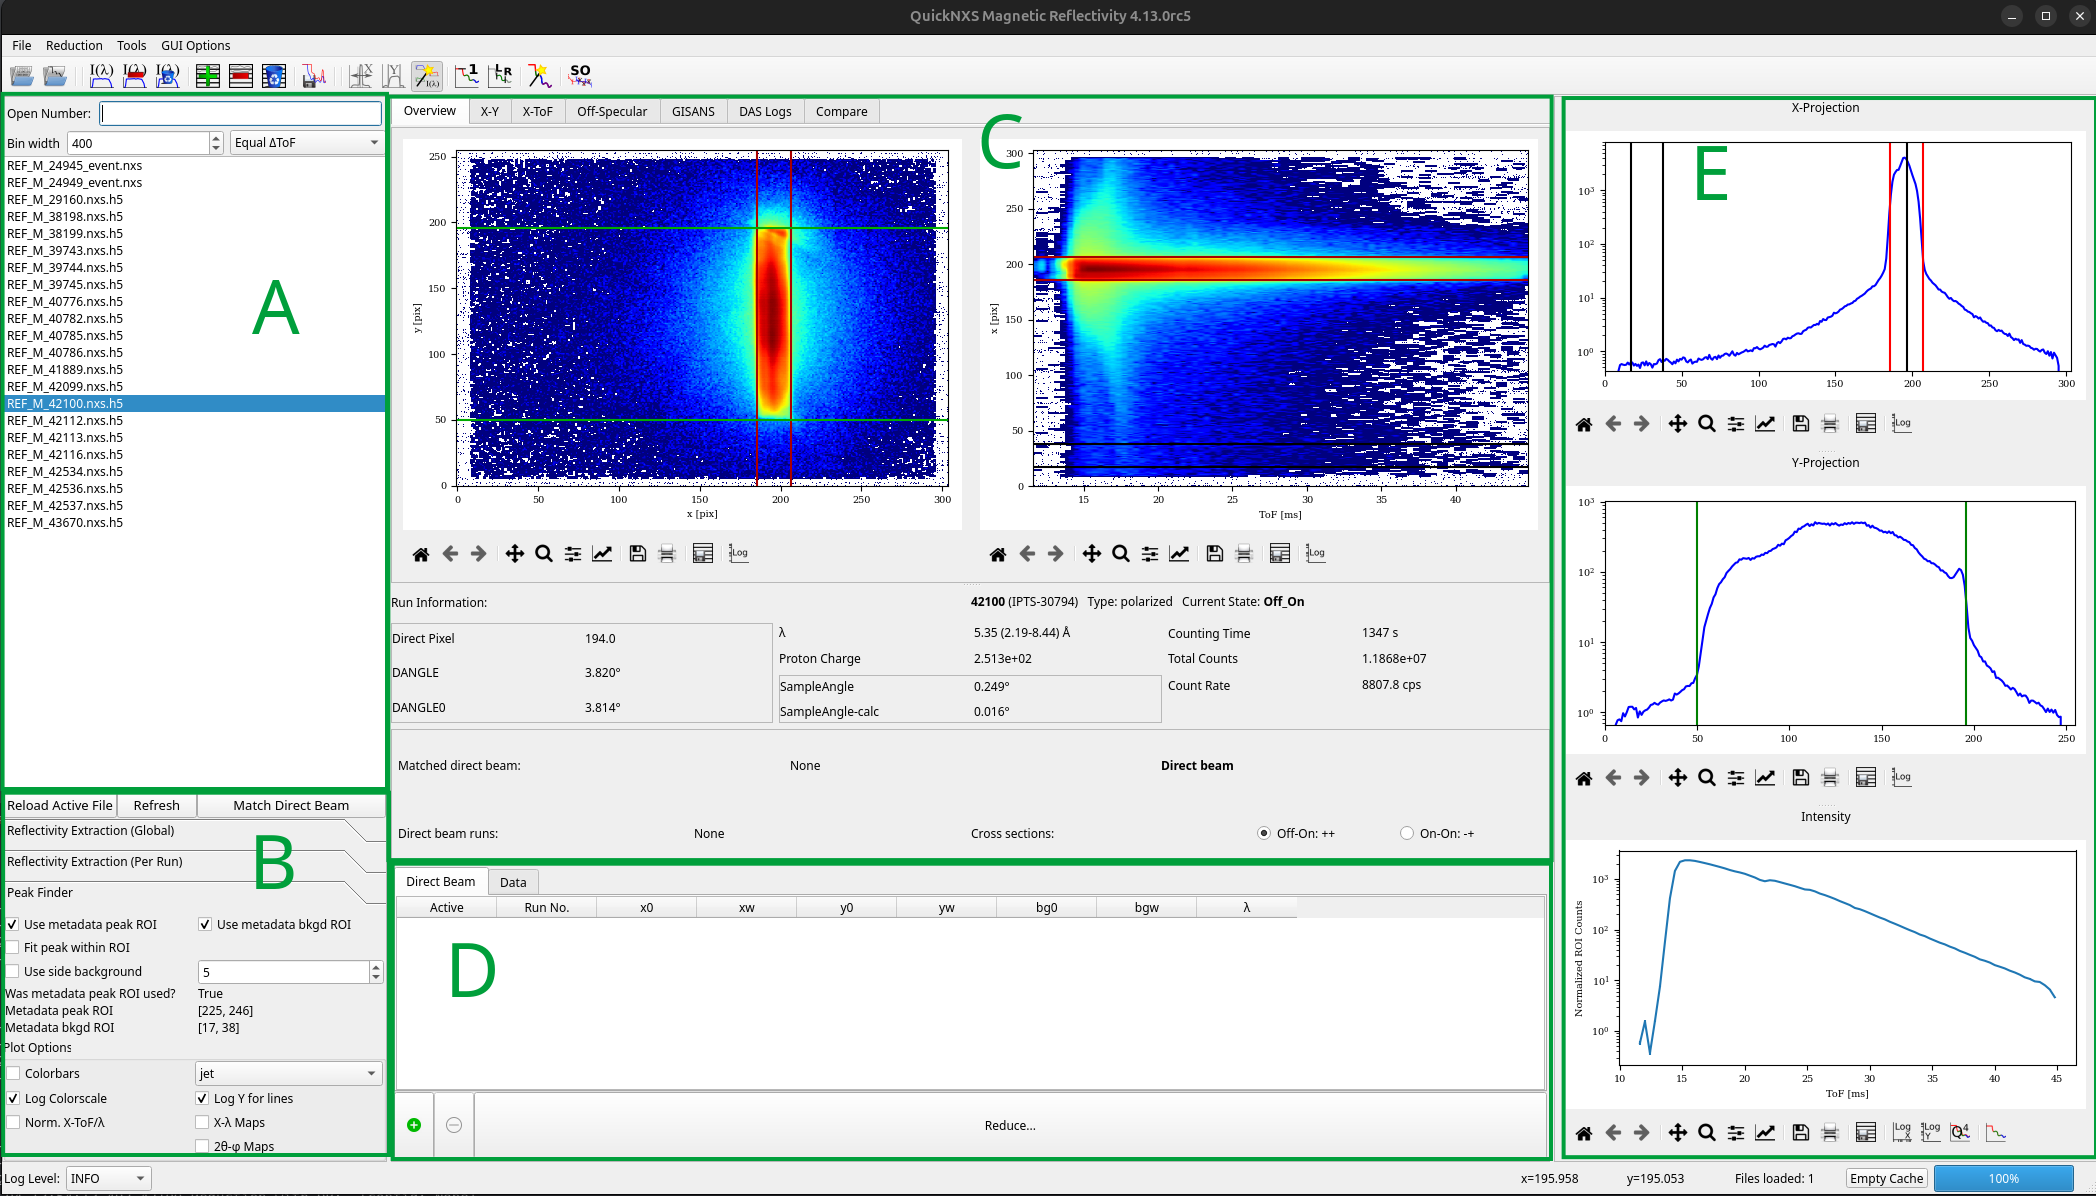
The main window is split into several key areas, labeled in the figure below:
A - A text entry box to search for Nexus files by run number and a list of neighboring data files for quick loading.
B - Stacked panels that expose configuration and ROI controls. The
Reflectivity Extraction (Global)andReflectivity Extraction (Per Run)panels house therefXPos/refXWidthspin boxes, binning selectors, normalization switches, and dead-time settings. Automatic peak finder settings and plot customization options are also located here.C - The main tab widget that holds the main overview tab which contains X-Y and X-ToF plots and various run information, as well as separate tabs for GISANS/off-spec tabs, the DAS log viewer, and more.
D - The reduction table with tabs for direct beam runs and reflectivity runs (labeled “Data”), and the “Reduce” button for initiating data processing.
E - Projection and intensity/reflectivity plots that visualize the current ROI selections and reduction results.
Top toolbar - provides quick access to common actions like opening files, adding runs to the data tables, and toggling certain functionality. Icons are grouped by function for ease of use. Hover over each icon to see its tooltip.
Bottom toolbar - log level selection and message area, progress bar for long-running operations, and a cache clear button to free up memory.
Core Workflow
Load data - use
File > Openor the numbered run search to load one or more event files. QuickNXS auto-populates the file list, reduction table, and status bar once a selection is made.Match a direct beam - assign direct beam runs through the dedicated tab or via the
Match Direct Beambutton. When a match exists, the UI can pull the direct beam ROI anddpixinto the reflectivity runs automatically.Tune ROIs - adjust ROI spin boxes, drag handles on the projection plots, or edit the reduction table columns. Every editor emits the same
changeRegionValuessignal, so the configuration stays synchronized no matter where the change originated.Process + inspect - QuickNXS recalculates reflectivity (or GISANS/off-spec) whenever inputs demand it, updating the main plot as well as the specular viewer. Tooltips and the status bar report long-running steps such as Mantid reductions or GISANS rebins.
Export or propagate - right-click menus let users export run tables, propagate settings across tabs, or remove runs. The context menu keeps bulk actions close to the data they act upon.
Feedback + Safeguards
The status bar shows cache usage, log level, and progress bars for Mantid operations, preventing the UI from feeling frozen during heavy reductions.
auto_change_activeguards protect the tables from emitting recursive change signals while scripts update cells programmatically. This makes the UI feel responsive even when hundreds of rows are touched.Validation is immediate: invalid numeric edits revert to the previous value and pop up an explanatory message. Direct beam lookups state when a run number is unknown, reducing silent mistakes.
Additional Notes
The direct pixel overwrite value (dpix) of a reflected run is linked to the peak position of its matched direct beam. Adjusting the peak position of a direct beam run will automatically update the dpix of all linked reflected runs to maintain consistency.